Place-by-place yield · PVGIS for twelve Scottish places
What would panels make where you live?
Choose the nearest place, the way your roof faces and a system size. Figures are PVGIS 5.3 long-run estimates at a 35° pitch with 14% system losses: an indicative result for comparison, not a survey of your roof.
3,612 kWh a year
About 144% of the 2,500 kWh a typical home uses each year (Ofgem). Part is used at home and part exported.
Indicative cost at the Scotland average: £7,800 (DESNZ 2025/26 mean per kW × size; our arithmetic, quotes vary).
Every place, same roof: kWh a year per kW
- Dundee938
- Dumfries908
- Perth907
- Edinburgh903
- Aberdeen893
- Stirling876
- Kirkwall854
- Glasgow853
- Inverness811
- Stornoway800
- Lerwick762
- Fort William675
Source: PVGIS 5.3, European Commission JRC, pulled 3 November 2026 for each place's town centre. Costs: DESNZ solar PV cost data, Scotland, 2025/26. Local shading and hills are not included.
Twelve places, six roofs
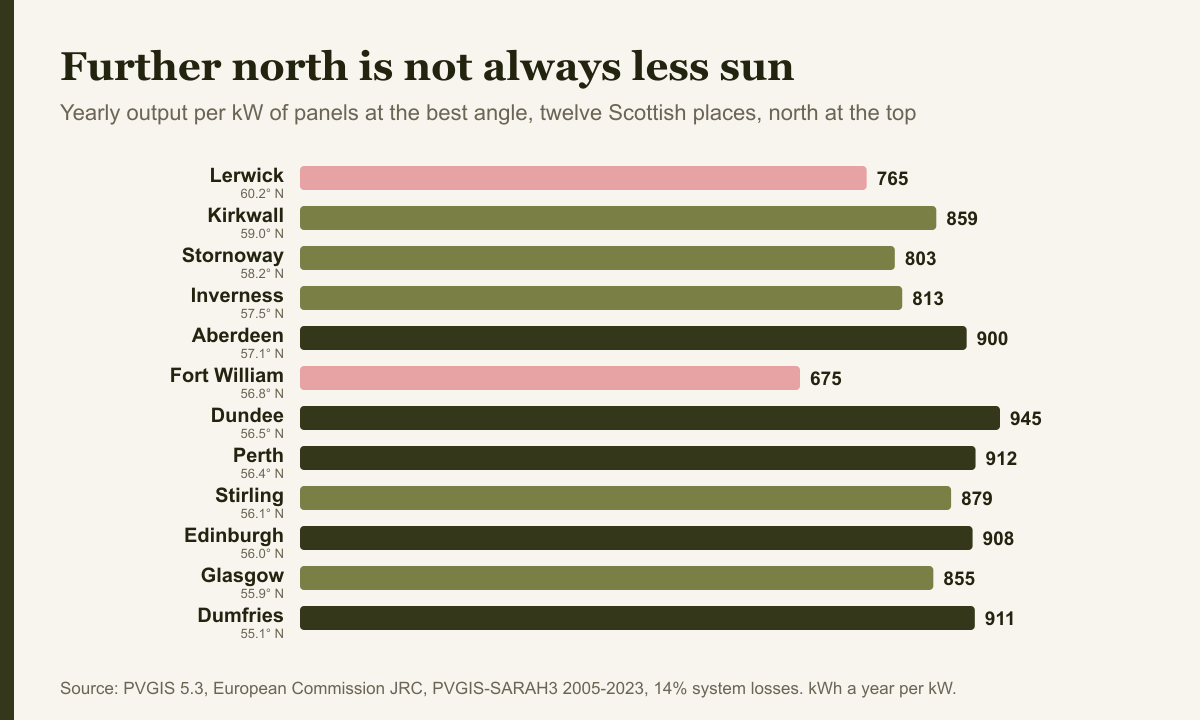
Every figure is kWh a year per kW of panels from PVGIS 5.3, the European Commission's solar model, using satellite records from 2005-2023 for each town centre and 14% system losses (PVGIS). Sorted from highest to lowest at the best angle.
| Place | Best angle | South 35° | East | West | Flat | South 20° | South 50° |
|---|---|---|---|---|---|---|---|
| Dundee | 945 | 938 | 722 | 721 | 755 | 888 | 939 |
| Perth | 912 | 907 | 707 | 710 | 743 | 864 | 905 |
| Dumfries | 911 | 908 | 715 | 717 | 751 | 868 | 902 |
| Edinburgh | 908 | 903 | 704 | 700 | 735 | 858 | 902 |
| Aberdeen | 900 | 893 | 685 | 687 | 719 | 846 | 895 |
| Stirling | 879 | 876 | 688 | 700 | 728 | 839 | 870 |
| Kirkwall | 859 | 854 | 660 | 679 | 704 | 815 | 851 |
| Glasgow | 855 | 853 | 673 | 683 | 710 | 817 | 847 |
| Inverness | 813 | 811 | 645 | 642 | 676 | 777 | 805 |
| Stornoway | 803 | 800 | 630 | 640 | 667 | 767 | 795 |
| Lerwick | 765 | 762 | 600 | 610 | 636 | 730 | 757 |
| Fort William | 675 | 675 | 561 | 565 | 604 | 664 | 656 |
Why the east coast wins
Latitude matters less than cloud. Dundee and Perth sit further north than Glasgow yet beat it comfortably, because the east is drier and sunnier: over 1991 to 2020 the Met Office recorded 1,449 hours of sunshine and 728 mm of rain a year at Edinburgh's Royal Botanic Garden, against 1,344 hours and 1,370 mm at Glasgow Bishopton (Met Office).
That is why several Scottish places outperform English cities on the same settings: PVGIS gives central Manchester 888 kWh per kW at its best angle, below Dundee, Perth, Dumfries, Edinburgh and Aberdeen. The wet west Highlands are the exception; Fort William's mountains and Atlantic weather put it lowest of the twelve.
Northern places also gain from the long summer day. In June the sun is up for far longer in Lerwick than in London, which is why the islands still produce well in summer even though winter output is very low. Our guide is solar worth it in Scotland shows the month-by-month pattern.
Diagonal and north-facing roofs
The same PVGIS run covers three roof directions the table leaves out. South-east and south-west slopes at 35° lose little: between 4% and 7% less than a south slope across the twelve places, by our arithmetic (Edinburgh: 848 and 843 kWh per kW, against 903). A north slope at 35° is another matter. It makes 52% of the south figure in Edinburgh and 51% in Aberdeen, but 62% in Fort William, where so much of the light is diffuse that direction counts for less. The tool above lets you pick any of these directions for your place.
When the output arrives
The yearly totals also hide very different shapes of year. By our arithmetic from PVGIS's monthly figures at the best angle, April to September brings 69% of the year's output in Edinburgh and 69% in Dundee, but 77% in Fort William and 78% in Lerwick.
June turns the ranking round. Kirkwall's panels make 118 kWh per kW that month, more than any other place on the list, Dundee (113) included, and Lerwick's 111 beats both Edinburgh and Glasgow (108 each). December runs the other way: 26 kWh per kW in Dumfries, 8 in Lerwick and 4 in Fort William. For an island or Highland home, most of a system's output arrives between spring and early autumn, so decisions about a battery should rest on summer figures, as our battery guide for Scottish homes shows month by month.
Reading the figures
- They are long-run averages. A sunny year beats them and a dull one falls short.
- They ignore your shading. Hills, trees, chimney heads and neighbouring tenements can all cut output; an installer should assess shading on site.
- They are generation, not savings. What a household saves depends on how much it uses as the power is made and on its tariffs, so compare kWh with your own bills.
- Pitch matters less than direction. The table shows that 20°, 35° and 50° south roofs are close; turning from south to east costs more.
To turn a kWh figure into a budget, use the Scottish prices on the cost page, and if you live in a tenement, read solar on tenements and flats first.
Checking your own address
If you live far from all twelve places, or in a glen where hills shade the winter sun, run PVGIS for your own roof (PVGIS). It takes a few minutes:
- Open the grid-connected PV calculation and type your address, or click your house on the map.
- Set the installed peak power to 1 kWp and the system loss to 14%, the default PVGIS suggests and the setting used throughout this page.
- Enter the roof's slope in degrees and its azimuth. PVGIS measures azimuth from due south: 0° is south, −90° is east and 90° is west.
- Multiply the yearly figure by the size of the system you are considering.
Keep the result beside any quote. A generation estimate far above it is worth questioning, one of the checks in our guide to choosing an installer in Scotland.